Performance Creative for Mobile Games: The UA & ASO Growth System Top Studios Use
Artstash Insights | May 12, 2026
Quick answer: Performance creative for mobile games is ad creative – video, playable, static or UGC-style – produced specifically to drive measurable user acquisition outcomes such as installs, Day 7 retention and ROAS. Every element, from the first-three-second hook to the CTA, is treated as a testable variable, produced in continuous cycles and iterated based on platform data. With audience targeting narrowed by privacy changes, performance creative is now the primary lever for scaling mobile game UA efficiently.
What Is Performance Creative for Games?
Performance creative for mobile games is the practice of producing ad creative – video, playable, or static – specifically to drive measurable user acquisition outcomes like installs, Day 7 retention, and ROAS. Every element, from the first-three-second hook to the CTA, is treated as a testable variable. Creative is produced in continuous cycles, tested at volume, and iterated based on platform data. The goal is not aesthetics. It is efficient scaling against creative fatigue in a market where audience targeting has narrowed and creative is now the primary UA lever.
Mobile game user acquisition has fundamentally changed. The playbooks that worked in 2020 (precise audience targeting, broad demographic segmentation, set-and-forget creatives) have been dismantled by privacy changes, platform consolidation, and a market producing over 50 billion app downloads annually. What replaced them is something more demanding and more rewarding: a tightly integrated system where performance creative, UA strategy, and App Store Optimization work together as a single growth engine.
The shift in plain terms: Creative is now the main performance lever. And the store listing is where all traffic, paid or organic, either convert or leak.
The studios pulling ahead in 2026 aren’t the ones with the biggest ad budgets. They’re the ones that have stopped treating creative, UA, and ASO as separate workstreams and started running them as one compounding system. This guide explains how that system works, what the data says about each component, and how to build it inside your studio.
What you’ll find in this guide:
- Why performance creative has become the dominant UA lever in mobile games
- How to build a UA creative strategy around volume, velocity, and signal
- How ASO amplifies paid UA – and how paid UA feeds ASO
- The flywheel that connects all three into a unified growth engine
- Practical frameworks for each discipline and how they interact
How Creative Testing Improves Mobile Game UA
Creative testing is not an optimization tactic. It is the primary mechanism by which UA teams reduce CPI, improve install quality, and generate audience intelligence that no targeting layer can replicate after ATT.
What Testing Actually Produces
Each creative test generates two things: a performance result and a signal about your audience. A gameplay hook that drives 4%+ CTR on iOS tells you which mechanic players find compelling before they install. That signal is worth more than the ad itself – it feeds store listing decisions, LiveOps priorities, and the next round of concept briefs.
The studios compounding fastest in 2026 are running creative testing as a continuous research operation, not a campaign-by-campaign exercise.
The Metrics That Separate Signal from Noise
Not all creative metrics are equally useful for UA decisions. The ones that matter, in order of strategic value:
| Metric | What It Measures | Why It Matters |
|---|---|---|
| IPM (Installs per Mille) | Creative’s conversion of impressions | Normalizes across networks and formats |
| Hook Rate | % of viewers past the first 3 seconds | Diagnoses whether the opening is working |
| D1 Retention | Install-to-session quality | Signals creative-to-game alignment |
| D7 ROAS | Early revenue from installed cohort | Predicts whether scale is sustainable |
| CTR | Click-through from impression | Detects fatigue early |
| CPI | Cost per install | Benchmarks against category norms |
The key distinction: CTR tells you the ad worked. D1 retention tells you the right person installed. Both matter. A low-CPI creative that drives high churn is not a winner – it is a budget drain with a good-looking headline metric.
A Practical Testing Cadence for Mid-Size Studios
- Launch phase: Run 5-8 new concept variants simultaneously, minimum 500 impressions each before drawing conclusions
- Signal phase: Identify top performers by IPM and CTR within 48-72 hours
- Scale phase: Increase spend on winning concepts while launching 3-5 iteration variants per winner
- Retirement phase: Pull creatives when CPI exceeds your target threshold by 20%, or when CTR decay signals frequency-driven fatigue
- Refresh phase: Feed learnings from retiring creatives directly into new concept briefs
The D30 ROAS benchmark for a successful creative variant is greater than 2x, according to Liftoff’s performance data. If a variant does not reach this threshold within its test window, retire it. Do not spend resources optimizing indefinitely.
When to Refresh Ad Creative
Creative fatigue is not optional. Without a structured refresh cycle, CTR can drop by up to 45% after just four exposures to the same asset, according to Business of Apps’ Mobile Gaming Marketing Trends Whitepaper 2026. The question is not whether to refresh – it is how to read the signals that tell you when.
The Two-Signal Rule
A single declining metric is noise. Two aligned signals are a confirmed fatigue event. Queue a refresh when at least two of the following appear together within the same 7-day window:
- Frequency above 3-4 impressions per user (on Meta; lower thresholds apply on TikTok)
- CTR declining 15% or more from the creative’s peak 7-day performance
- CPI increasing 15% or more from the creative’s best 7-day window
A sustained IPM drop of 20% or more over 5-7 days is also a standalone trigger worth acting on.
Refresh by Level, Not by Instinct
Not every fatigue event requires a full concept replacement. Admapix’s creative refresh framework identifies three levels of intervention:
- Level 1 – Hook Swap (1-2 day turnaround): Replace the first 3 seconds. Use this when CTR is down but watch-through rate is stable – the hook is fatigued but the body is still working.
- Level 2 – Format Variant (3-5 day turnaround): Reformat the same concept – square vs. vertical, shorter runtime, static extraction, or a playable version. Extends concept life without new ideation.
- Level 3 – Concept Evolution (1-2 week cycle): Apply what you know about audience response patterns to a new brief. Keep the proven hook style and emotional tone; change the concept entirely.
Platform-Specific Refresh Thresholds
Refresh cadence is not universal. The same creative that runs for eight weeks on Apple Search Ads may fatigue in two weeks on TikTok. Admiral Media’s fatigue curve data provides the following operational defaults:
| Channel | Typical Peak Duration | Default Refresh Window | Primary Fatigue Driver |
|---|---|---|---|
| Meta Advantage+ (apps) | 10-21 days | 3-5 weeks | Frequency in core audience |
| TikTok Ads | 7-14 days | 2-4 weeks | Trend velocity and feed shifts |
| Google App Campaigns | 14-28 days | 3-6 weeks | Asset rotation depth, view-rate decline |
| Apple Search Ads | 28-56 days | 6-10 weeks | Conversion-rate drift vs. keyword set |
The structural fix: No single creative should carry more than 30-40% of your total impression volume. Run a three-layer creative stack at all times – proven performers (60-70% of spend), active tests (20-30%), and a ready pipeline of pre-approved concepts waiting to deploy.
Why Performance Creative Is Now the Primary UA Lever
For most of mobile gaming’s growth era, targeting was the engine. You found the right audience, pointed ads at them, and optimized bids. Creative mattered, but it was secondary to who you were reaching. That changed with Apple’s ATT framework and the broader industry shift away from deterministic user-level data.
“Creative is the new targeting. Targeting precision has narrowed in recent years, and creative has become the primary performance driver. In 2026, marketing teams test creatives constantly, not occasionally.” – Gamelight, 2026 Guide to Mobile Game Marketing Strategy
The numbers back this up. According to industry data from games.gg, mobile game advertisers ran an average of 123 active creatives per month in 2025, a 19.4% year-over-year increase. Top advertisers are now testing between 2,400 and 2,600 creatives per quarter. These are not vanity metrics; they reflect a fundamental restructuring of how studios allocate creative resources.
What “Performance Creative” Actually Means
Performance creative is not a design philosophy. It is an operating model. The goal is not to make beautiful ads, it’s to make ads that drive measurable outcomes: installs, first sessions, Day 7 retention, ROAS. Every creative decision is evaluated against those metrics.
The key distinctions from traditional game marketing creative:
| Traditional Creative | Performance Creative |
|---|---|
| Brand-led, aesthetic-first | Metric-led, outcome-first |
| Produced in campaigns | Produced in continuous cycles |
| Tested occasionally | Tested constantly (100+ variants/week) |
| Judged on approval | Judged on CPI, CTR, ROAS |
| Designed for awareness | Designed for install-to-retention |
The Format Shift: Video Dominates, Gameplay Hooks Win
Video creatives now account for 74.1% of all mobile game ad volume, up 14.2% year-over-year. But the format within video matters as much as the format itself.
Gameplay demo ads outperform cinematic trailers by a measurable margin. On iOS, gameplay demos generate a median CTR of 4.27% versus 3.34% for cinematic trailers, a 28% relative difference. Ads that show actual gameplay within the first three seconds see 25% higher view-through attribution.
The practical implication: If your creative team is still leading with high-production cinematics, you are paying more to convert less. The data consistently favors authentic, gameplay-first hooks over polished brand storytelling.
Playables have also surged. According to Gamelight’s 2026 mobile marketing guide, playable ad impression share nearly doubled in a single year, driven by platforms rewarding higher engagement signals and users preferring to experience gameplay before installing.
Building a UA Creative Strategy Around Volume, Velocity, and Signal
Most studios underinvest in creative volume and overinvest in creative polish. The math does not support that approach. With global UA spending reaching $25-29 billion in 2026 and paid install share growing 10% year-over-year while ad impressions grew 20%, the competitive intensity means a single well-produced creative no longer moves the needle. You need a system.
The three pillars of a modern UA creative strategy are volume, velocity, and signal.
Volume: The Baseline Has Shifted
One hundred creative variants per week is no longer exceptional. For studios competing in top-grossing categories, it’s the floor. The 58% monthly creative refresh rate seen across the industry in 2025 exists for one reason: audience fatigue is faster than most studios expect.
This doesn’t mean producing 100 versions of the same ad. Volume without strategic differentiation accelerates fatigue rather than preventing it. As one analysis of creative testing data noted: “Volume without strategy accelerates audience fatigue. Superficially different creatives with identical hooks decay faster than genuinely distinct concepts.”
What high-volume creative production actually requires:
- A modular creative system (swappable hooks, CTAs, characters, and gameplay moments)
- AI-assisted production for variant generation, not just ideation
- Clear separation between concept testing (new ideas) and iteration (optimizing proven winners)
- A defined retirement threshold – when a creative’s CPI crosses a set ceiling, it exits rotation
Velocity: The Testing Cadence That Separates Top Studios
Testing creatives “constantly, not occasionally” is the phrase that keeps appearing in top-performing studio analyses. But velocity is not just about frequency, it’s about the speed from signal to decision.
A practical creative testing cadence for mid-size studios:
- Launch phase: Run 5-8 new concept variants simultaneously, minimum 500 impressions each before drawing conclusions
- Signal phase: Identify top performers by CTR and IPM (installs per thousand impressions) within 48-72 hours
- Scale phase: Increase spend on winning concepts while launching iteration variants (3-5 per winner)
- Retirement phase: Pull creatives when CPI exceeds your target threshold by 20% or frequency-driven fatigue is visible in CTR decay
- Refresh phase: Feed learnings from retiring creatives back into new concept briefs
The D30 ROAS benchmark for a successful creative variant is greater than 2x, according to Liftoff’s performance data. If a variant doesn’t reach this threshold within their test window, retire it. Don’t spend resources optimizing it indefinitely.
Signal: Reading What the Data Is Actually Telling You
Creative data tells you more than which ad won. It tells you what your audience responds to about your game: the mechanics, emotional triggers, progression moments, and characters that drive intent to install. That intelligence should flow directly back into game design, LiveOps decisions, and store listing creative.
“UA isn’t just a marketing afterthought; it’s now driving how games are built, monetized, and scaled.” – Matej Lancaric, Substack
The metrics that matter most in performance creative for games, ranked by strategic value:
| Metric | What It Tells You | Why It Matters |
|---|---|---|
| IPM (Installs per Mille) | Creative’s ability to convert impressions | Normalizes across networks and formats |
| D1 Retention | Whether the install audience matches the game | Signals creative-to-game alignment |
| D7 ROAS | Early revenue signal from installed cohort | Predicts whether scale is sustainable |
| CTR | Hook effectiveness | Diagnoses creative fatigue early |
| CPI | Cost efficiency | Benchmarks against category norms |
The studios that extract the most value from creative data are those that treat it as product intelligence, not just media reporting.
App Store Optimization for Mobile Games: Where Paid Traffic Converts or Leaks
ASO is where the work your creative and UA teams do either pays off or gets wasted. A strong ad that drives a user to a poorly optimized store listing is a leaky funnel. The click happened; the conversion did not. And with over 2 million apps competing for visibility across major stores, the store listing is now a performance asset whether or not your team treats it as one.
The relationship between paid UA and ASO is bidirectional. Paid traffic tests which creative hooks and messaging resonate. ASO uses those insights to optimize the store listing. The store listing then improves conversion rates for both paid and organic traffic, lowering blended CPI across the board.
“When your UA teams drive targeted traffic to ASO-built custom store pages, it lowers CPI by improving conversions.” – Zoriana Omelchuk, CAS.AI
The Four ASO Levers for Mobile Games
1. Visual Assets (Screenshots and Preview Video)
For games, visuals are the primary conversion driver in the store listing. Players make install decisions in seconds. Appradar’s ASO research identifies screenshots and preview videos as the most impactful elements for game listings, outweighing keyword rankings for conversion rate optimization.
What performs:
- Screenshots that show actual gameplay, not menus or loading screens
- Captions that communicate a core loop or emotional hook within 2-3 words
- Preview videos that mirror the pacing and format of your best-performing UA creatives
- Animated previews where supported, as dynamic visuals measurably improve engagement
2. Keyword Strategy
Keyword optimization drives organic discoverability, which compounds the value of every paid install. For Google Play, ASOMobile recommends targeting one keyword per 250 characters of description, prioritizing mid-volume, high-relevance terms over broad competitive keywords where ranking is unlikely.
For the App Store, the 100-character keyword field is your primary organic lever. Priorities:
- Target keywords your UA campaigns are already generating intent around
- Include genre terms, mechanic descriptors, and competitor-adjacent terms
- Avoid keyword stuffing; the algorithm rewards relevance, not density
3. Custom Product Pages (iOS) and Custom Store Listings (Google Play)
This is where UA and ASO integration becomes a direct revenue lever. Both platforms allow studios to create variant store listings that match specific ad campaigns or audience segments. A user who clicked a puzzle mechanic ad arrives at a store page emphasizing puzzles. A user who clicked a PvP ad arrives at a page emphasizing competition.
The conversion impact is significant. Studios running creative iteration programs report 20-50% lifts in conversion rates when store page messaging is aligned with incoming ad creative. That lift directly reduces CPI without touching ad spend.
4. Ratings, Reviews, and Social Proof
Organic conversion rates are heavily influenced by rating volume and recency. A game with a 4.6 rating and 10,000 recent reviews converts at a meaningfully higher rate than the same game with 4.6 and 200 reviews. This is not just an ASO metric – it is a UA cost metric. Higher organic conversion rates lower your effective CPI on every paid campaign.
ASO Metrics That UA Teams Should Track
Most UA teams track CPI, ROAS, and retention. Fewer track the ASO metrics that directly influence those numbers. The ones that matter:
- Conversion rate (CVR): Percentage of store page visitors who install. Benchmark varies by genre, track your own trend over time.
- Impression-to-page visit rate: How often your app appears in search results and gets clicked through to the listing.
- Organic install uplift: The increase in organic installs correlated with paid campaign periods – a signal of brand halo effect.
- Keyword ranking velocity: How quickly new keywords reach top-10 positions after optimization.
The Growth Flywheel: How Performance Creative, UA, and ASO Compound Together
The reason most studios underperform is not that they are bad at creative, UA, or ASO individually. It is that they run them as separate workstreams with separate teams, separate reporting, and separate optimization cycles. The compounding effect only happens when the three disciplines share data and inform each other in real time.
Here is how it works when it’s running properly:
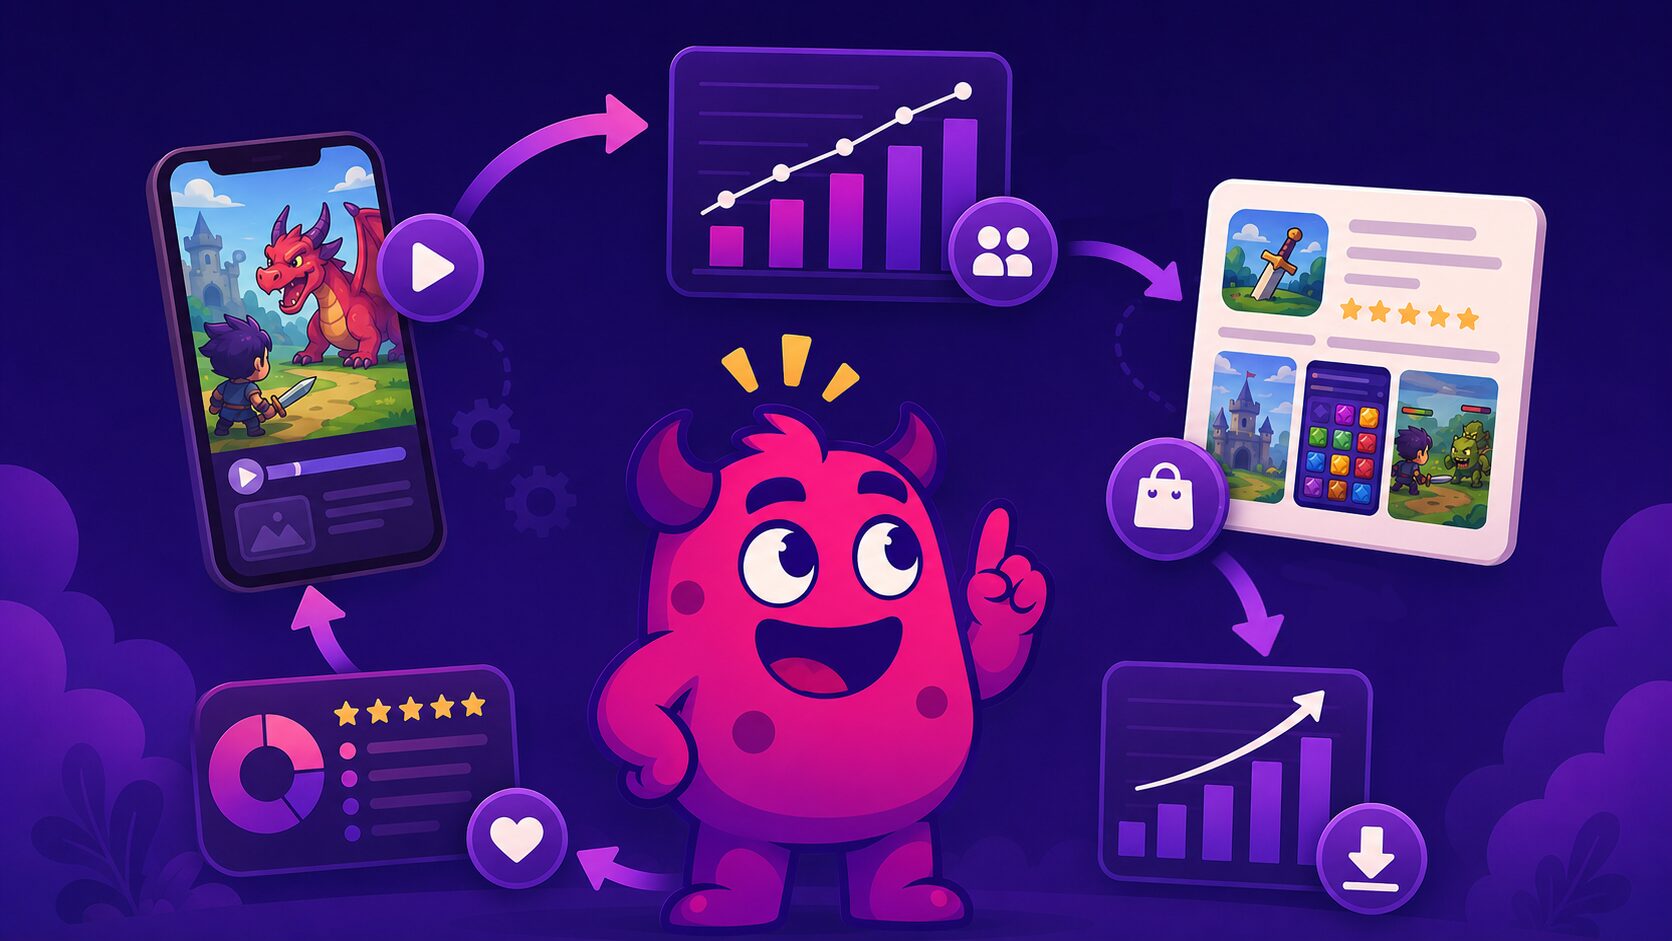
The Five-Stage Integration Loop
Stage 1: Creative signals what the audience wants Performance creative testing generates high-signal data about which signals drive install intent. A gameplay hook that generates 4%+ CTR is not just a good ad, it’s market research. It tells you what players find compelling about your game before they install it.
Stage 2: UA scales what works and retires what does not UA takes the winning creative signals and allocates spend accordingly. Losing concepts are retired quickly (within 48-72 hours of sufficient data). The budget concentrates on proven hooks while the creative team develops the next round of concept tests. Meta Platforms alone accounts for 69% of social gaming impressions, meaning the feedback loop from Meta campaigns is often the fastest and most reliable signal available.
Stage 3: ASO aligns the store listing with the winning creative The hooks that perform best in paid ads should appear in your store listing screenshots, preview video, and short description. A user who saw a puzzle mechanic ad and arrives at a store page showing the same mechanic has a shorter path to install. That alignment is where the 20-50% conversion rate lift comes from.
Stage 4: Improved ASO conversion lowers blended CPI When store page CVR improves, every paid install becomes effectively cheaper. You’re still spending the same on media, except you’re converting more of the traffic you buy. This creates headroom you can use to increase UA spend, test more creative concepts, or improve margins. All three of which feed back into the flywheel.
Stage 5: Organic installs compound the return on paid spend A well-optimized store listing captures organic search traffic that paid campaigns generate as a halo effect. Organically acquired users show approximately 4.5% retention at 8 weeks, a strong baseline that improves LTV calculations and justifies continued UA investment. The paid campaign builds brand visibility; ASO harvests it.
Where the Flywheel Breaks Down
Understanding the failure modes is as important as understanding the model. The three most common points of breakdown:
- Creative-to-game misalignment: Ads that promise rapid progression but deliver slow grind mechanics produce installs that churn on Day 1. As Gamelight’s data shows: “If your ads promise rapid progression but your game delivers slow grind mechanics, churn accelerates.” This destroys ROAS regardless of how strong the creative is.
- Siloed teams: When the UA team, creative team, and ASO team report separately and share data infrequently, the feedback loop slows to a crawl. Creative learnings take weeks to reach store listings. Winning hooks get retired before ASO can use them.
- Optimizing for installs rather than quality: High-volume, low-CPI installs from misleading creatives inflate download numbers and destroy retention metrics. D7 retention is the earliest reliable signal that the install cohort is the right audience.
The diagnostic question for any studio: Are your best-performing ad creatives reflected in your current store listing? If the answer is no, you have an integration gap that is costing you conversions every day.
AI in the Creative-UA-ASO System: Production Tool, Not Strategy Replacement
Over 90% of mobile game advertisers now use AI tools in their creative production workflow. That number, from the SocialPeta and Reforged Labs joint analysis covering 6 million advertisers and 1.6 billion ad creatives, reflects how quickly AI has moved from experimentation to baseline infrastructure.
But the studios getting the most from AI are not using it to replace creative strategy. They are using it to execute strategy faster.
Where AI Adds Genuine Value in the Growth System
Creative production at scale: AI-assisted tools generate variant hooks, localized versions, and format adaptations in a fraction of the time manual production requires. This is what makes 100+ variants per week achievable for mid-size studios without proportionally scaling headcount.
Pattern detection in creative data: Machine learning identifies performance signals that human analysts miss: subtle correlations between visual elements, hook timing, and downstream retention metrics. As one analysis of AI-driven UA noted: “AI experiments with visuals and messaging in real-time, detecting subtle patterns humans miss.”
Real-time A/B testing automation: Scalable A/B testing via ML reduces manual effort while running simultaneous tests across multiple creative variables. The result is faster signal generation and more confident scaling decisions.
ASO keyword intelligence: AI tools are increasingly used for keyword gap analysis, search trend monitoring, and automated A/B testing of store listing elements – particularly preview videos and screenshot sequences.
The Strategic Risk: Volume Without Differentiation
The widespread adoption of AI has created a new problem. When every studio can produce 100 variants per week, the competitive advantage of volume alone disappears. The studios that win are those with better creative concepts, not just more of them.
“AI shifts from ‘production’ to ‘strategy’, allowing for diagnostics and monetization in midcore and casino games.” – AppsFlyer/Newzoo, Mobile Gaming Benchmarks 2026
The implication is clear: AI handles execution. Human strategic judgment determines what to execute. The studios treating AI as a replacement for creative strategy are producing high volumes of undifferentiated content that decays faster than it converts.
The practical balance looks like this:
- AI generates variants, localizations, and format adaptations
- Human strategists define the concepts, hooks, and emotional angles to test
- Data determines which concepts scale and which retire
- Human insight interprets what the data means for the next creative brief
This is not a future state. It is how the best-performing studios are already operating in 2026.
How Artstash Creative Approaches Creative Iteration
Most agencies hand over a batch of creatives and call it a deliverable. That is a production model, not a growth model. Artstash Creative operates as an integrated growth partner – which means creative iteration is not a service add-on, it is the core of how campaigns are structured from day one.
The Integrated Creative Iteration Model
Artstash’s approach to performance creative for mobile games is built around three principles that most studios lack internally:
1. Concept diversity before volume Volume without strategic differentiation accelerates fatigue. Before scaling production, Artstash maps distinct creative angles across hook type (gameplay, outcome, social proof, challenge), emotional register (frustration, aspiration, curiosity, competition), and format (video gameplay demo, playable, UGC-style). Each angle is treated as a separate hypothesis, not a variant of the same idea.
2. Signal-to-brief feedback loops Every creative that exits rotation generates a brief update. What hook style held attention longest? Which game mechanic drove the highest D1 retention? That intelligence feeds directly into the next production sprint – not into a report that gets filed. The result is a creative library that compounds knowledge over time rather than starting from zero each cycle.
3. ASO alignment as a standard output Artstash treats store listing alignment as a mandatory step in every creative iteration cycle, not an afterthought. When a new hook concept wins in paid UA, the store listing screenshots, preview video, and short description are updated to match. This is where the 20-50% conversion rate lift comes from – and it requires the creative and ASO workflows to be managed together, not handed off between separate teams.
What This Looks Like in Practice
For studios working with Artstash, the operational cadence looks like this:
- Week 1-2: Concept audit and hook mapping across existing creative library. Identify what has been tested, what angles are missing, and where the store listing is misaligned with top-performing ads.
- Ongoing: Weekly creative launches (new concepts and iteration variants), 48-72 hour signal reviews, and a standing retirement threshold applied consistently rather than by judgment call.
- Monthly: Store listing alignment review against the current top-performing creative concepts. Custom product page updates for major UA channels.
The goal is a system that does not require emergency decisions. Creative fatigue is managed proactively, not reactively.
Examples from Mobile Game Campaigns
The patterns below are drawn from published industry data and platform-level research, illustrating how the creative-UA-ASO system performs when integrated correctly.
Gameplay Hook vs. Cinematic Trailer: The CTR Gap
Across iOS campaigns analyzed in the 2026 mobile game advertising trends report from games.gg, gameplay demo ads generated a median CTR of 4.27% versus 3.34% for cinematic trailers – a 28% relative difference. Ads showing actual gameplay within the first three seconds saw 25% higher view-through attribution.
The practical implication: studios still leading with high-production cinematics are paying more to convert less. Gameplay-first hooks are not a creative trend. They are a measurable performance advantage.
Playable Ads: Impression Share Nearly Doubled in One Year
Playable ad impression share nearly doubled year-over-year in 2026, according to Gamelight’s mobile marketing guide. The driver is twofold: platforms reward higher engagement signals, and players demonstrably prefer experiencing gameplay before installing. For puzzle, casual, and midcore titles, playables consistently outperform standard video on install-to-retention quality because the user self-selects based on actual game mechanics rather than a produced representation of them.
Custom Store Pages: The Conversion Rate Lift
Studios running creative iteration programs that align custom product pages (iOS) and custom store listings (Google Play) with incoming ad creative report 20-50% lifts in conversion rates compared to their default listing. The mechanism is straightforward: a user who clicked a puzzle mechanic ad and arrives at a store page showing the same mechanic has a shorter decision path. Reducing that friction is where blended CPI falls without touching media spend.
The Organic Halo Effect of Paid Campaigns
Organically acquired users – those who discover a game through store search during or after a paid campaign period – show approximately 4.5% retention at 8 weeks, a strong LTV baseline. This is not coincidental. Paid campaigns build search volume and brand familiarity; a well-optimized ASO listing harvests that demand as organic installs. Studios that track organic install uplift during paid campaign windows consistently find that the return on UA spend is higher than their paid-only attribution suggests.
What are the pros and cons of performance creative for mobile games?
| Pros | Cons |
|---|---|
| Every ad is judged on installs, Day 7 retention and ROAS, so budget follows what works | Concepts fatigue, so production never really stops |
| Store pages that match the ad lift conversion and lower blended CPI without extra media spend | Optimising purely for CPI can attract low-quality installs |
| Gameplay-first hooks beat cinematics on click-through rate (Figure 1) | Cheap AI volume without a clear idea behind it just adds noise to your tests |
| Learnings compound across campaigns, UA and ASO | Smaller budgets struggle to reach significance on every test |
Our take: the cons are real, but they are process problems. The fix is a creative testing pipeline, not fewer tests.
Building the System: Where to Start
The studios that will scale efficiently in 2026 and beyond are not the ones with the largest creative teams or the highest ad budgets. They are the ones that have built the tightest feedback loop between creative testing, UA deployment, and ASO conversion.
If you are starting from scratch or auditing an existing setup, the highest-leverage interventions in sequence are:
- Audit creative-to-store alignment: Compare your top three performing ad creatives against your current store listing. If the hooks, visuals, and messaging do not match, fix that before anything else. It is the fastest CPI reduction available without touching media spend.
- Establish a creative testing cadence: Define your concept test frequency, minimum impression thresholds, and retirement rules. Make them written policy, not informal judgment calls.
- Build custom store pages for your top UA channels: Create at least one custom product page (iOS) or custom store listing (Google Play) aligned to each major traffic source. Measure CVR uplift against your default listing.
- Close the signal loop: Set up a shared reporting view where creative performance data, UA efficiency metrics, and ASO conversion rates are visible to all three teams in the same dashboard.
- Define your AI role: Decide what AI handles (variant production, localization, keyword research) and what it does not (concept strategy, hook development, creative direction). The boundary matters.
The core principle: Every install you buy is an opportunity to learn something about your audience. Every store page visit is a creative test. Every organic install is a return on the paid investment you already made. When these three disciplines share data and inform each other, the system compounds. When they operate in silos, it leaks.
Frequently Asked Questions
How much does performance creative for mobile games cost?
Pricing depends on the format mix (playables, UGC, trailers, CGI, statics, motion graphics, localization), testing volume and cadence, so agencies such as Artstash Creative quote bespoke per project rather than off a rate card. The best starting point is to get in touch with a brief covering your game, channels and current UA metrics.
Which ad channels does performance creative for games run on?
The same creative system feeds every major UA channel, including Meta, Google, TikTok, Snapchat, AppLovin and Unity. Formats and hooks are adapted per channel, since a TikTok-native UGC ad and an AppLovin playable compete in very different environments.
Can AI replace a performance creative team?
No – AI is a production tool inside the system, not a strategy replacement. It adds genuine value in accelerating variant production, but volume without differentiation is a strategic risk: when every studio can generate lookalike ads at scale, concept quality and signal-based iteration are what separate winners.
What is performance creative in advertising? Performance creative is ad creative where every element – hook, format, CTA, offer framing – is treated as a measurable variable and tested against real platform data. Unlike traditional brand creative, which is judged on aesthetics or approval, performance creative is judged on outcomes: CPI, CTR, ROAS, and downstream retention. It is built to drive a specific measurable result and iterated continuously based on what the data shows.
What is performance creative for mobile games specifically? In mobile games, performance creative refers to ad assets (video, playable, static, or UGC-style) produced specifically to drive app installs and retain quality users. The discipline includes concept development, high-volume testing across variants, signal-based retirement of underperforming assets, and continuous iteration. Because mobile game ads compete for attention in the same feeds as every other app category, performance creative for games requires gameplay-first hooks, rapid refresh cycles, and direct alignment with the store listing the user lands on after clicking.
How often should mobile game ads be refreshed? There is no universal cadence – it depends on channel, audience size, and spend level. On Meta, top-spending creatives typically need refreshing every 3-5 weeks. On TikTok, the cycle is shorter: 2-4 weeks, because feed trends and audience saturation move faster. The trigger is not a calendar date. It is two aligned signals: frequency above threshold AND a 15%+ decline in CTR or increase in CPI from the creative’s peak 7-day window. A single declining metric is noise. Two together are a confirmed fatigue event.
What makes a good UA creative pipeline for mobile games? A strong UA creative pipeline for mobile games has three layers running simultaneously: proven performers (60-70% of spend, monitored for fatigue), active tests (20-30% of spend, new concepts and iteration variants in early validation), and a ready pipeline of pre-approved concepts waiting to deploy. No single creative should carry more than 30-40% of total impression volume. The pipeline should be fed by signal-to-brief loops – every retiring creative generates a brief update for the next concept sprint, so the library compounds knowledge rather than resetting.
How does ASO affect UA performance? ASO directly affects the conversion rate of every paid install campaign. A user who clicks an ad and lands on a store listing that mirrors the ad’s messaging and visuals has a shorter path to install. Studios that align custom product pages (iOS) and custom store listings (Google Play) with their top-performing UA creatives report 20-50% lifts in conversion rate compared to their default listing. That lift reduces blended CPI without changing media spend – which is why ASO is a UA efficiency lever, not just an organic discoverability tool.
What metrics should UA teams track for performance creative? The metrics that matter most, in order of strategic value: IPM (installs per mille, normalizes across networks), Hook Rate (percentage of viewers past the first 3 seconds), D1 Retention (signals creative-to-game alignment), D7 ROAS (early revenue signal from the installed cohort), CTR (detects fatigue early), and CPI (benchmarks against category norms). D30 ROAS greater than 2x is the standard benchmark for a creative variant worth scaling.
The mobile games market generated $82 billion in revenue in 2025. The studios capturing disproportionate share of that are not doing so through bigger budgets. They are doing it through tighter systems.
If you want an expert team to build or optimize your performance creative, UA strategy, and ASO as an integrated growth system, Artstash Creative works with mobile game studios globally from indie developers to top publishers. Get in touch to discuss your growth challenges.
Share this article
Related Articles

The Rise of ‘Quiet Marketing’ in Mobile Gaming

Animating with AI: What We’re Learning from Blending Game Capture and AI Motion